Wherein I forsake a programmer’s life for a season or more in R.
I owe most of my life’s earnings to Python and the people who taught me to program in it. But when I started a master’s at the London School of Hygiene and Tropical Medicine (LSHTM), I knew I’d have to set it aside for a year. Some seasons later, I start a series about the tool I used most that year: R.
It was an interesting, but good, time. Two initial reflections from it follow.
1. The time machine
| Operating system | Year | Statistical package | Year |
|---|---|---|---|
| UNIX | 1969 | SPSS | 1968 |
| MS-DOS | 1981 | SAS | 1976 |
| MacOS | 1984 | Stata | 1985 |
| Microsoft Windows | 1985 | S ("New S") | 1988 |
| Linux | 1991 | R | 1993 |
| iOS | 2007 | ||
| Operating system | Year | ||
| UNIX | 1969 | ||
| MS-DOS | 1981 | ||
| MacOS | 1984 | ||
| Microsoft Windows | 1985 | ||
| Linux | 1991 | ||
| iOS | 2007 | ||
| Statistical package | Year | ||
| SPSS | 1968 | ||
| SAS | 1976 | ||
| Stata | 1985 | ||
| S ("New S") | 1988 | ||
| R | 1993 |
When starting an applied statistics degree, one is quickly reminded that people have been using the same statistical packages for a very long time. SAS and SPSS, for instance, are older than the personal computer. Stata, which both LSHTM and Johns Hopkins Bloomberg use for nearly all computer-based instruction, is only one year older than the Macintosh.
Working with these packages in my practical sessions often felt like going back in time. SAS, with its program blocks and copious post-run reports, demanded nearly the same, slow supplication as sending batch jobs to an IBM mainframe. Using Stata, in contrast, felt like that great first step forward into interactive computing: like DOS or UNIX, its fundamental UI is a command line interface, driven by a glass teletype.
Compared to these, R felt very nearly like present day: a read-eval-print-loop (REPL), attached to a general purpose programming language with all the features (control structures! variables, first class functions, readline!) that a programmer would expect. Better yet, R’s functionality included an enormous package repository: almost any feature you’d need is in CRAN, be that for causal inference, survival analysis, random effects, Bayesian sampling, or otherwise.
But I did say “very nearly.” Because for all its modernity, R is still a product of its place and time: not so much for user interaction – REPLs have been around for a very long time1 – but for language design, much of which stems from work at Bell Labs on S in the 1980s. Three examples:
- In keeping with the general object-oriented programming (OOP) heyday of the late 20th century, S added an OOP system in the 1980s…then another in the 1990s. Both systems, plus another that’s specific to R, are commonly used.2
- S came before the rise of the world wide web. Possibly in keeping with this, R’s library and language documentation for a long time were best viewed as print-matter documents (books, papers, and later, PDFs – I remember reading many R PDFs when first using it in 2004) or as manual pages within the REPL. A tendency towards this in CRAN’s documentation remains to this day: for an example, here’s the landing page for dplyr’s documentation in contrast to, say, Python’s pandas.
- As a relatively early dynamic language, S and then R seem to hail from that time when everything should be permissible and expressible (I’m thinking of my time working with you two, Perl and Ruby). We tend to see a great variety of ways, and packages, for doing the same thing. This may not be the worst thing, but it still feels like a far cry from C or Go’s parsimony, or even Python’s aim for “only one way to do it”.
All the same, my days with R were almost always preferable to days in any other statistical package. Indeed, it was just nearly perfect. Where it wasn’t, and what that might have been about, form the second and last reflection.
2. Multiplicity and the local maximum
I first used R for making plots sixteen years ago, and in the intervening years I became a software engineer. So when I came back to R, I went looking for the typical things:
- Package and package version management (something like
virtualenv) - A unit testing library
- A SQLite (or other database) library
- Error handling
- Easy variable introspection
- Logging
- Integration with a text editor
- Support for some kind of HTML output
- Straightforward ways to run programs and compose them together
- A reasonably small universe of packages needed for any given task.
I found all of them. Some had caveats, but others were better than I could have ever asked for.
Of the caveats, packages were easily the biggest, foremost because the number
of interdependent packages needed per task seems to be pretty high –
more like Node.js than, say, Python or Go.3 This pushes you
quickly to wanting some way to manage them all. But unfortunately, the
most recommended package version manager,
Packrat, regularly failed to
install the same packages, and in a way I’d never seen pip or any go
tooling do. Its caching option was also only useful in the most minimal
of
cases.
After working around it for months, I finally just gave up and did
some ugly scripting instead.
On the other hand, R Markdown was absolutely outstanding, even if it turned logging to the console into a challenging set of incantations. dplyr was a delight for dataframe manipulation, and testthat was an entirely serviceable unit test library. Even errors, though they worked differently than I had expected, were certainly manageable.
Piecing all of these parts together, I came to the following heuristics:
- Find a good text editor integration and use it. (I used Nvim-R.) This may introduce you to different kinds of packaging pain, because your editor won’t always know how to start R in the right place and with the right settings. It will still be worth it.
- Unless you commit to R Studio (which didn’t run on the current version of Ubuntu…although of all things, Stata did), use something other than Packrat to manage dependencies. A directory of package archives that you install with an R script, a docker image…pretty much anything will require no more time, and possibly less, than might be spent debugging Packrat, waiting for it to download the same things over again, and so forth.
- Prepare your data using R scripts run by a
Makefile– either into flat text files, or into a SQLite database. (I found the latter to be exceptionally useful for larger projects, much more than I initially realized. All credit goes to my advisor, Nuño Sepulveda, for pointing the gist of this out.) - Knit your R Markdown documents also as tasks from the
Makefile. - Write unit tests for your data. And yes, into the
Makefileagain. - There are usually three to four libraries for any task or analysis
you need to do. (This discussion of
dplyrversusdata.tableis a good example.) Don’t be afraid of trying them all out. You will probably have to, anyway.
Through these heuristics, I would say I had a reasonably productive time in R. In fact, for the sorts of work I was up to, I will say R was the best tool on hand: the local maximum for the space. I’ll use it again, whenever I need to do an analysis that’s best supported by something in CRAN, or when I’m working with other people such as epidemiologists or biostatisticians.
All this said, it is not a language I am likely to use for any sort of
software project. Nor is it a language I would deploy into a production
environment. I have the greatest respect for people who work in R. Out
of an extraordinary assortment of OOP systems, LISP-styled lazy
evaluation, and occasional C++, they are building facile and often
performant interfaces for data analysis. Whenever I’m struggling against
R’s inconsistencies (why have na.omit(), but then is.na()? Or why
do we set the number of CPUs with options("profile.ncpus"=4), but then
get them by calling getOption("profile.ncpus")?), they’re stepping
over it all and getting things done. Whereas for me, there is just too
much variation, both within R and between R and other runtimes,
to feel comfortable using it in a professional system.
Of course and in closing, this, too, is the result of its own local maximum. Since first looking at R in 2004, I had become someone who ran internet services, and occasionally, even scalable ones. Things like package versioning and installation, which at least one highly effective R programmer found too time consuming to set up in Python, had long since become non-negotiable requirements for me. To get a service deployed into a reproducible environment, I was going to spend however much time it took.
Similarly, I was going to face a very different kind of multiplicity most days: not one within a language and its ecosystem, but instead one that arose from an ever-growing array of orchestration, monitoring, logging, load balancing, and persistence systems deployed around various languages and runtimes. For these kinds of systems, languages like Python, Go, and even Java offered both a lower cognitive and a lower computational load.
And so, it’s all elsewhere than R again for me, at least until the next good analysis comes around. But I’m very glad for the seasons I spent in it. And I’m looking forward to writing more about it in the months to come, at least in those few, rare instances where a little software engineering might make a statistician or analyst’s life easier.
Errata
2020-01-21: the first version of this post credited R’s first release to 2000, but as a reader pointed out, it was first released all of seven years earlier, in 1993. (Ihaka, Ross. “R: Past and Future History.”)
2020-01-24: I’ve not added it to the text above because it’s a bit polemic – but after reading this post, a data scientist, Python programmer, and exceptional colleague of mine from Wellcome pointed me to Patrick Burns’s The R Inferno. She had been referred to it after hitting a first R gotcha while working on her PhD. For a similar work in this genre, albeit with similar limitations, cf. The UNIX Haters Handbook.
In fact, read-eval-print-loops (REPLs) actually precede every statistical package above. The seminal, read-eval-print-loop (REPL) system, John McCarthy and Steve Russell’s LISP Programming System, was announced in 1960.
↰From Hadley Wickham’s Advanced R:
There are multiple OOP systems to choose from. In this book, I’ll focus on the three that I believe are most important: S3, R6, and S4. S3 and S4 are provided by base R. R6 is provided by the R6 package, and is similar to the Reference Classes, or RC for short, from base R.
There is disagreement about the relative importance of the OOP systems. I think S3 is most important, followed by R6, then S4. Others believe that S4 is most important, followed by RC, and that S3 should be avoided. This means that different R communities use different systems.
S3 and S4 use generic function OOP which is rather different from the encapsulated OOP used by most languages popular today. . . . basically, while the underlying ideas of OOP are the same across languages, their expressions are rather different. This means that you can’t immediately transfer your existing OOP skills to R.
I sometimes worked in fear that I would need to understand such things. But thankfully, in a year and a half of using R for occasional work, plus one summer of using it every day, I rarely had to interact with these different OOP systems.
↰As an example: some of the packages being installed while working on a distributed lag model for hospital visits, using packrat:
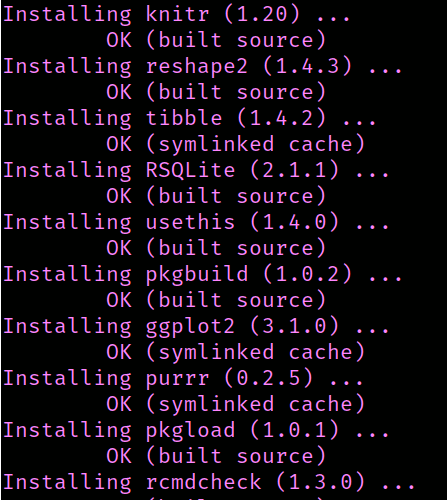
(Although I’m pretty sure it took longer than this animation for all of these packages to install.)
↰